


Q1) What is the appropriate investment horizon for SIPs?
SIP Period | Positive Return % | More than 7% Return | More than 10% Return | More than 12% Return |
3 Years | 82% | 65% | 55% | 48% |
5 Years | 89% | 70% | 55% | 43% |
10 Years | 96% | 86% | 68% | 46% |
15 Years | 100% | 99% | 93% | 69% |
20 Years | 100% | 100% | 99% | 74% |
25 Years | 100% | 100% | 99% | 53% |
Consistency in Returns: Longer SIP durations increase the certainty of positive returns, reaching 100% for extended periods.
Higher Returns Likelihood: The chance of achieving over 7% returns grows with longer investment horizons, e.g., 65% for 3 years vs. 100% for 10+ years.
Less Risk with Time: Extended SIP durations historically reduce variability in returns in Nifty 50.
10-Year Advantage: A 10-year SIP period markedly improves the chances of returns over 7%, 10%, and 12% compared to 5 years

There’s no discernible difference in returns (XIRR%) across daily, weekly, and monthly SIPs. One should prioritize convenience; the frequency doesn’t impact outcomes.
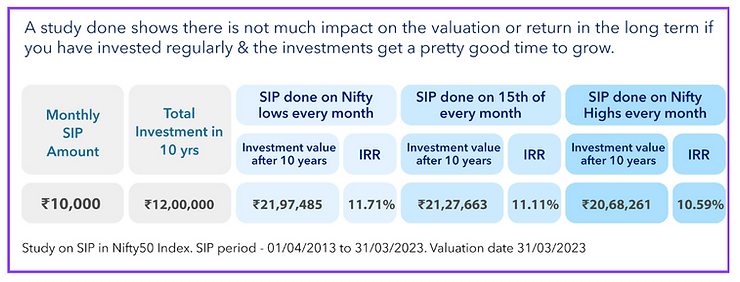
Many of us try to invest in lows and sell in highs. Theoretically, this is not a bad idea. However, in practice, it is incredibly difficult to time the market.
As we can not time the market, there is a high possibility that we miss good opportunities of lows / miss opportunity to invest itself.
If you really see the data, even if you perfectly time the market, the difference is not much. So it is better to be disciplined.

We compared the effects of occasionally missing instalments against adding extra instalments over a 20-year SIP period.
Key Insight


Key Insight
Investor | Reaction to Crash | DEC 2020 XXIRR | Dec 2020 Abs Returns |
Aliya | Stopped SIP & Redeemed. | -12% | -6% |
Katrina | Stopped SIP but stayed invested. | 20% | 9% |
Vidya | Continued SIP & Stayed invested. | 51% | 22% |
Source: ACE MF
SIP in Nifty 50 has been considered for return calculation and the balance is bank account.
Vidya, who continued with her SIP despite the market crash reaped the highest returns, once the markets recovered.
We analyzed returns for SIP investors who began right before the three most substantial market corrections:
1992 – Harshad Mehta Scam

2000 – Dotcom Bubble

2008 – Global Financial Crisis

Key Insight
Despite major market downturns, consistent SIP investments historically rebound and yield long-term growth. Patience during market adversities proves beneficial.
Consider an investor who began Rs 10,000 per month SIP* long time back and is hit by a hypothetical 50% market correction today.
SIP Start Date | Value as of Oct 2023 | Value after 50% Fall | Value in Deposits |
Sept 2003 | Rs 91,90,774 | Rs 45,95,387 | Rs 45,77,330 |
Sep 1998 | Rs 1,96,49,256 | Rs 98.24.628 | Rs 80,08,951 |
Sep 1993 | Rs 3,09,23,430 | Rs 1,54,61,715 | Rs1,26,35,103 |
Source: AceMF, RBI *Investment considered in Nifty 50
Key Insight
Even if we imagine a significant 50% market correction, long-term Systematic Investment Plans (SIPs) have historically outperformed traditional fixed deposits.
It is important to note that markets tend to recover after substantial declines. Therefore, if investors remain patient during these periods, they typically will recover their market value losses.
SIP Start Date | Invested Amount | Market Value (Oct 2023) | Value in Bank Deposit |
Sep 2018 | Rs 6,00,000 | Rs 7,49,664 | RS 6,89,165 |
Sep 2013 | Rs 12,00,000 | Rs 20,02,309 | Rs 16,41,643 |
Sep 2008 | Rs 18,00,000 | Rs 35,10,859 | Rs 30,76,893 |
Sep 2003 | Rs 24,00,000 | Rs 69,36,092 | Rs 51,09,846 |
Sep1998 | Rs 30,00,000 | RS 1,36,63, 884 | Rs 78,78,381 |
Source: ACE MF, RBI
Note: Analysis includes all equity funds including thematic, sectoral, and passive excluding global.
Even the least successful funds surpassed bank deposit returns over these periods.

Key Insight
Historically over the long term in all the above periods SIP has done better than Gold and Bank Deposits

Key Insight
With a minimal 1000 rupees step-up, the expected returns grew significantly.
30+ Lakh additional return if the returns are 12% 50+ Lakh additional return if the returns are 15% You can generate more wealth with step-up. WHEN YOU HAVE THE LEVER IN YOUR HAND WHY MISS THE OPPORTUNITY

Key Insight
If you notice Small-Cap performance is was the worst performer in the year 2016 and it is in the bottom of the chart. But in 2017 and again bounced back 2020, and 2021, Small-Cap is the best performer.
International funds have best performed in 2013, but worst in 2022.
While the debt instruments and gold give consistent returns, best performance has always been Equity funds
Equities may not delivery every year, but over long term, they deliver best returns.
Please Contact Us to start your mutual funds investment journey today.
Disclaimer: For Illustration purposes only. The past performance of the mutual funds is not necessarily indicative of the future performance of the schemes.